Stop Guessing Which App Is Spending on Bedrock
.png)
It’s month end, and your company is paying its AWS Bill, and the Bedrock cost looks absurd. You see that the cost comes from one or more models, but you have no idea which application it comes from. What do you do?
The Direct Model ID Approach
You have different applications in AWS, some use Bedrock and it is done by specifying the model id and model region. This is the natural way if you want to quick start and it’s the most obvious choice if you are just starting to explore Bedrock. And when you clearly track only one app and its usage its totally fine. But the same can still have development, staging and production usage. How do you track the per environment usage?
Cost Tracking Breaks Here
Every invocation of the same model and in the same region is indistinguishable when you track the cost. You don’t know what usage you are paying for? Whether it’s coming from an actual usage bump from your customers in production applications or just the developer testing in the development environment. Every model call works but its still anonymous.
This is where Bedrock Inference Profiles comes in,
Bedrock Inference Profiles
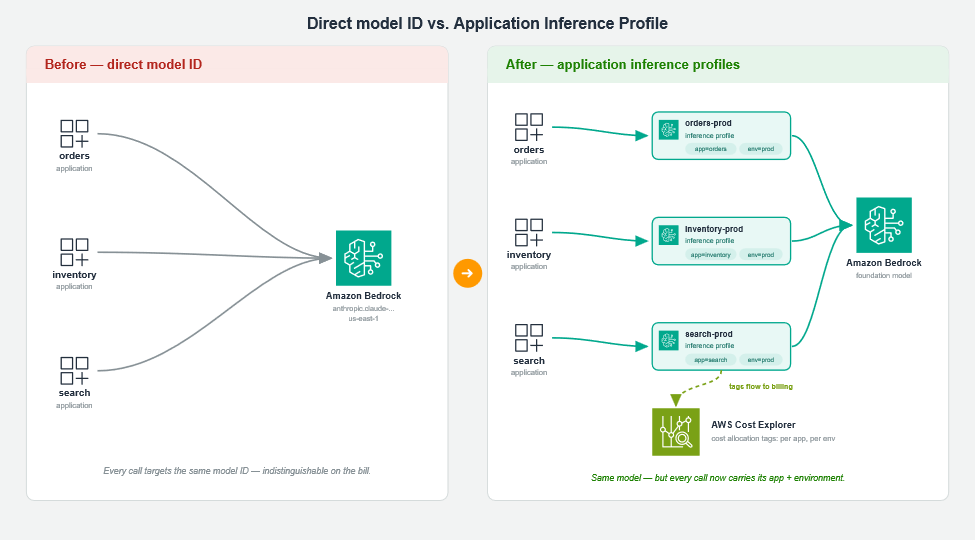
An inference profile is a resource you route your inference requests through instead of passing a raw model ID and it can carry metadata and span regions. For cross region routing there’s system-defined inference profiles which are AWS managed and then there’s Application Inference Profiles which you create yourself and which can carry your own tags. Which will then help you find the anonymous spikes later.
Tagging by App and Environment
Take all the different kinds of Bedrock usage in your company and give each one its own inference profile — split by application, and by the environment it runs in. For example: finance-ai-prod, inventory-app-staging, and so on. Then tag each profile with something meaningful like Application and Environment (app=orders, env=prod).
# orders service, production
aws bedrock create-inference-profile \
--region us-east-1 \
--inference-profile-name 'orders-service-prod' \
--description 'Orders service - production' \
--model-source '{"copyFrom": "arn:aws:bedrock:us-east-1::foundation-model/anthropic.claude-3-5-sonnet-20241022-v2:0"}' \
--tags '[
{"key": "app", "value": "orders"},
{"key": "env", "value": "prod"},
{"key": "team", "value": "checkout"}
]'
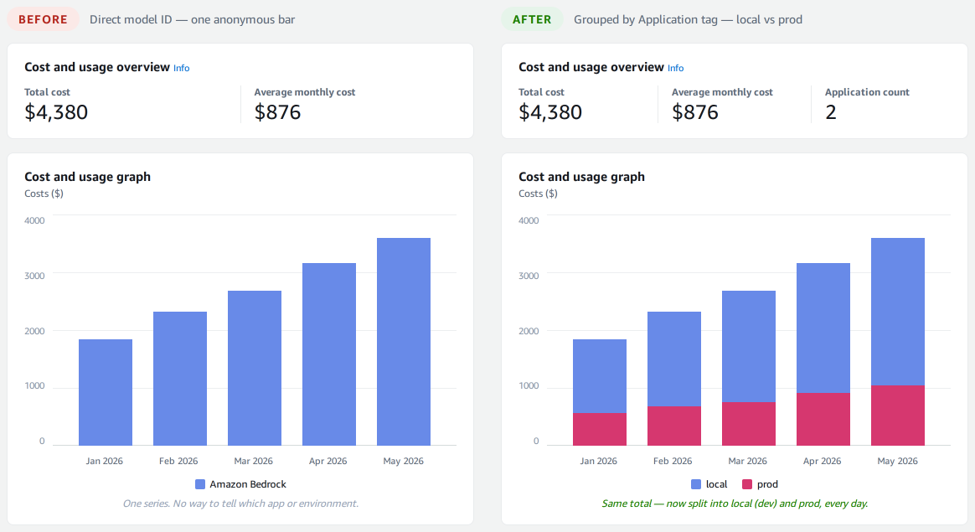
Now these tags become your cost allocation tags in your cost explorer, this means spending is now split by each unique usage you want to have. This also means you know exactly what you are paying for. Now on the month end bill you see exactly where each usage is from clearly in your cost explorer reports.
More Than Just the Bill
Cost tracking is the reason you came here, but it's not the only thing you walk away with. Once your apps are routing through inference profiles instead of raw model IDs, a few other things also get easier almost for free.
And one of it is you can put real budget alerts on these. Since the spend is tagged per application and per environment, you can set up AWS Budgets that watch a specific tag and alert you when, the numbers say something mysterious like the development is having more usage than the production while there was no testing going on for the application that month.
There's also the cross-region side of things. The same inference profile mechanism is what makes cross-region inference easier, requests can be routed across regions automatically for better resilience and throughput, without you hardcoding region logic into every app. You get the routing flexibility and the cost visibility from the same building block.
And because your apps now point at a profile ARN instead of a model ID, you've got a single place to manage things. Want to see invocation counts and latency per inference profile? It's there in CloudWatch, split it the same way you split the costs. The inference profile becomes the one handle you reach for, whether the question is "what is this costing me" or "how is this performing."
Where to Start
If your company runs more than a handful of apps across dev, staging, and prod, this is something you should be doing if you already aren’t and you don't have to build anything from scratch to get the value out of it.
Don't try to migrate everything at once. Start with your single highest spend app on Bedrock, which is quietly anonymously eating your credits. Get it in an application inference profile, tag it with the app and environment, activate the tags, and give it a day. You will see clearly the anonymous usage coming out of the shadows.
And the next time it's month end and someone asks which app is driving the Bedrock spend, you won't be guessing. You'll just open Cost Explorer, group by application, and point at the chart.